INSIGHTS & IDEAS

Growth Insights

Strategy, psychology, and the thinking behind revenue that actually grows.

Snow shovel beside a rising price tag, illustrating price fairness and dynamic pricing

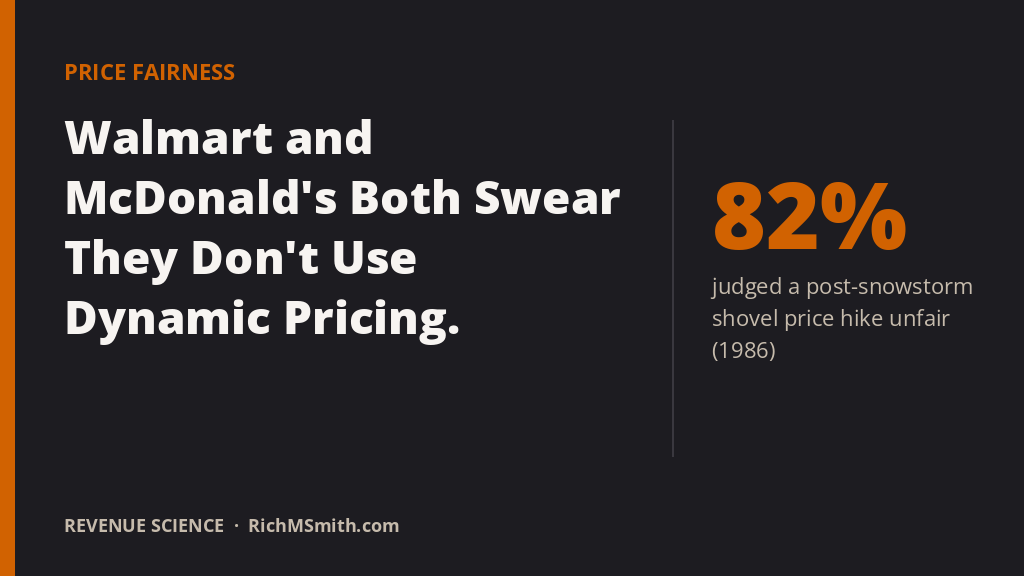
Walmart and McDonald’s Both Swear They Don’t Use Dynamic Pricing. A 1986 Study Explains Why They Have To.

In early October, Walmart published an open letter to answer a charge it had heard for months: that its new digital shelf labels were infrastructure for surge pricing. Its head of corporate affairs, Dan Bartlett, was blunt. Walmart, he wrote, does not raise prices “in response to a hot afternoon

Pratfall effect: McDonald's CEO's awkward burger bite and what it means for brand trust

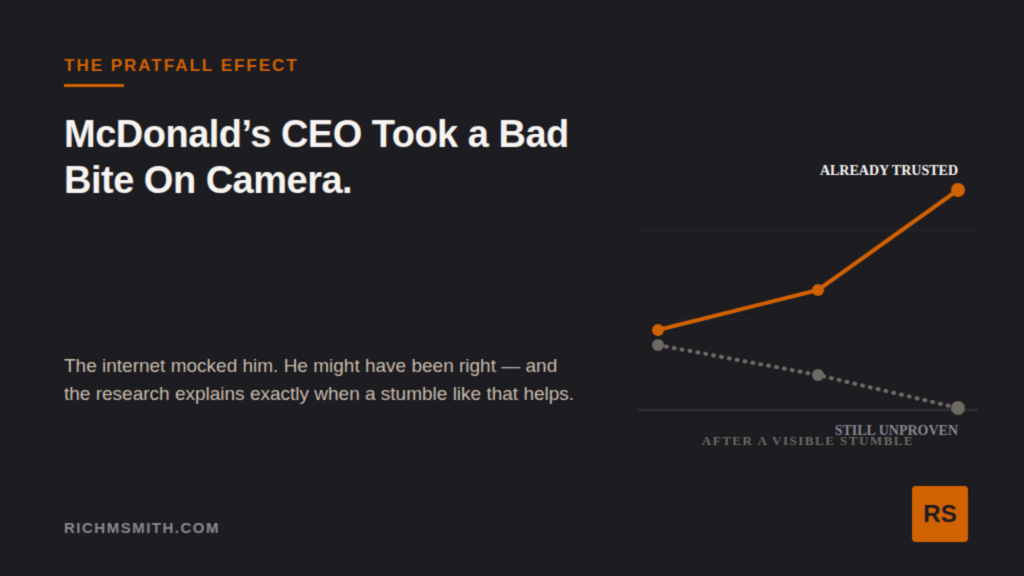
McDonald’s CEO Took a Bad Bite On Camera. The Internet Mocked Him. He Might Have Been Right.

Chris Kempczinski, chairman and CEO of McDonald’s, picked up the company’s new Big Arch burger for a promotional Instagram Reel, stared at it for a beat too long, took a bite so small it barely qualified, and called it “a product.” Burger King replied that it couldn’t finish it either.

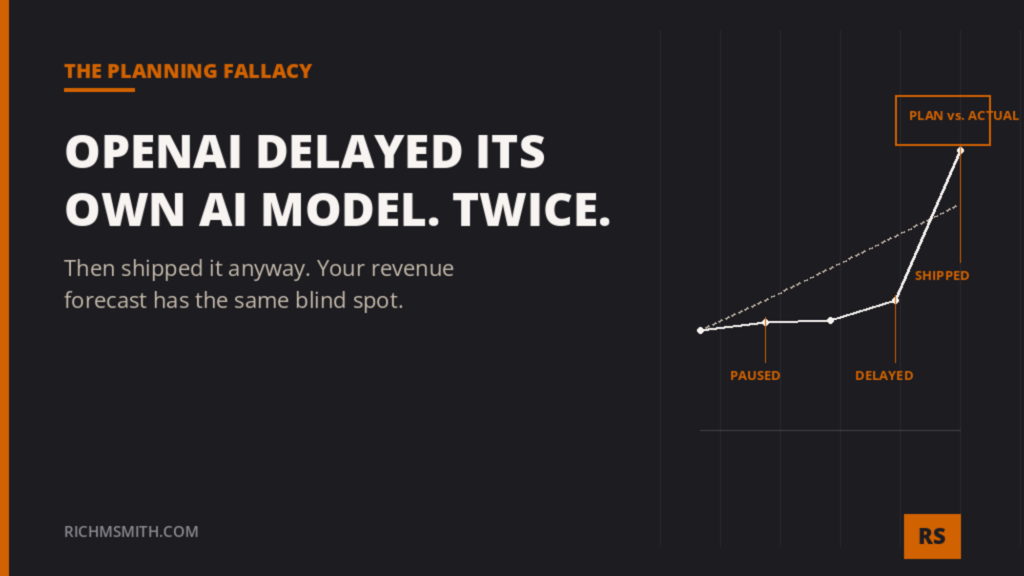
Planning fallacy diagram comparing predicted project timelines vs actual completion times in revenue forecasting

OpenAI Delayed Its Own AI Model Twice, Then Shipped It. Your Revenue Forecast Has the Same Blind Spot.

OpenAI delayed its own AI model twice, then shipped it anyway. Why even the best-resourced teams misjudge timelines, and what that means for your revenue forecast.
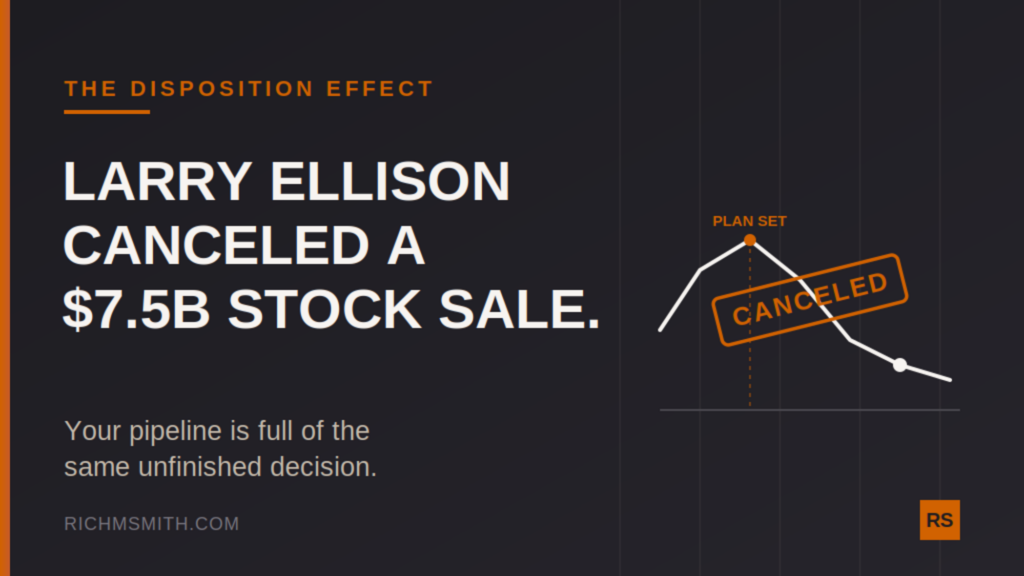
Disposition effect graph showing realized gains vs losses and its impact on sales pipeline management

Larry Ellison Canceled a $7.5 Billion Stock Sale. Your Pipeline Has the Same Problem.

On June 22, Larry Ellison’s advisors set up a trading plan to sell as many as 50 million shares of Oracle stock. Oracle was worth considerably more that day than it would be later. By the time the plan became public on September 11, those shares were worth roughly $7.5

Illustration illustrating the sunk cost fallacy in business through Sega's cancelled Super Game project.

Sega Killed Its “Super Game.” Why Most Companies Keep Funding the Past.

Five years ago, Sega set out to build something no single title in its catalog had ever been: a global, always-on live-service game with the scale ambitions of Fortnite. Internally it was called the Super Game. This spring, Sega ended it. The company’s May 12 fiscal-year results quietly stated the

Psychological reactance diagram illustrating coffee badging and return to office mandate compliance

Companies Mandated 12% More Office Time. They Got 2% More Attendance.

Somewhere in a downtown office tower this month, an employee badged in at 9:02 a.m., poured a cup of coffee, said hello to two colleagues, and left by 9:40. On the attendance report, that counts as a full day in the office. In a 2026 survey of 1,000 employees under
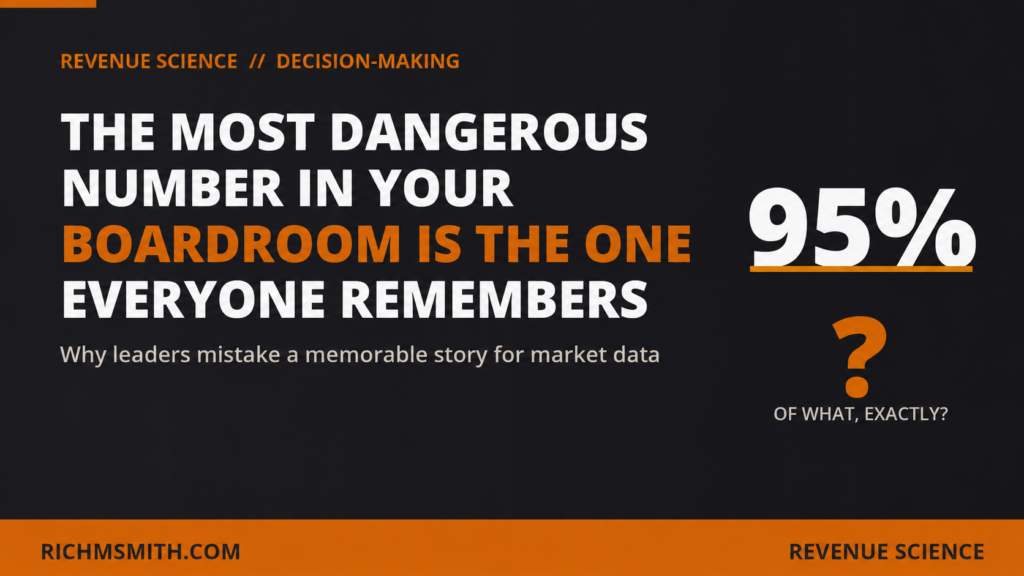
Availability heuristic diagram explaining boardroom decision making and base rate neglect in corporate strategy

The Most Dangerous Number in Your Boardroom Is the One Everyone Remembers

Why leaders mistake a memorable story for market data — and a six-question test to catch it before it costs you. Depending on which headline you read this year, AI is either transforming the global economy or failing 95% of the time. Both statements can point to real research. Neither

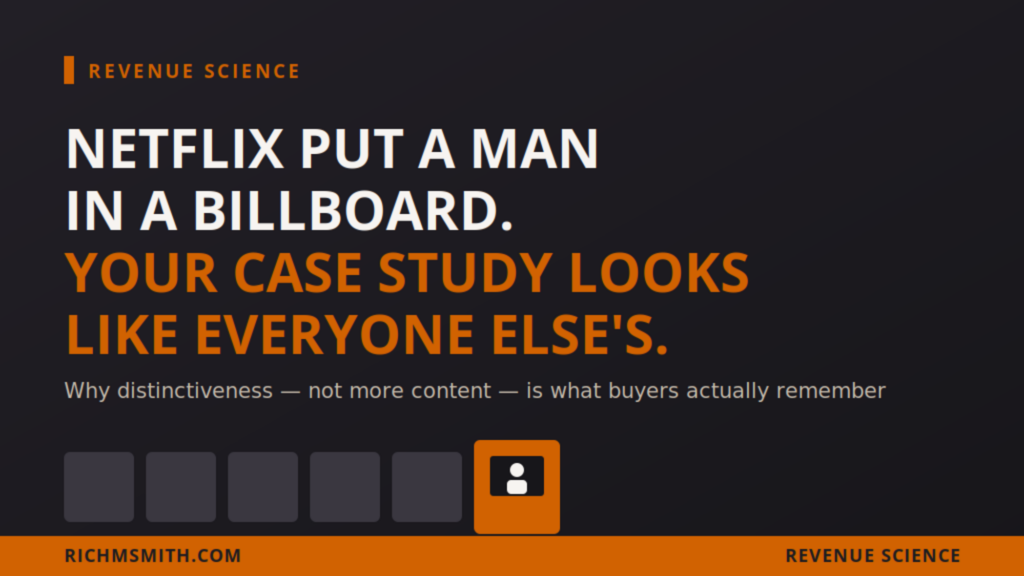
Isolation effect diagram analyzing the Netflix billboard stunt and B2B brand distinctiveness

Netflix Put a Man in a Billboard. Your Case Study Looks Like Everyone Else’s.

On August 6, 2026, commuters on Sunset Boulevard passed a billboard advertising Netflix’s new thriller The Last House. Nothing unusual there — that stretch of Los Angeles carries hundreds of movie ads a year. Except this one had a working window, a stocked bookshelf, red curtains, and a man actually

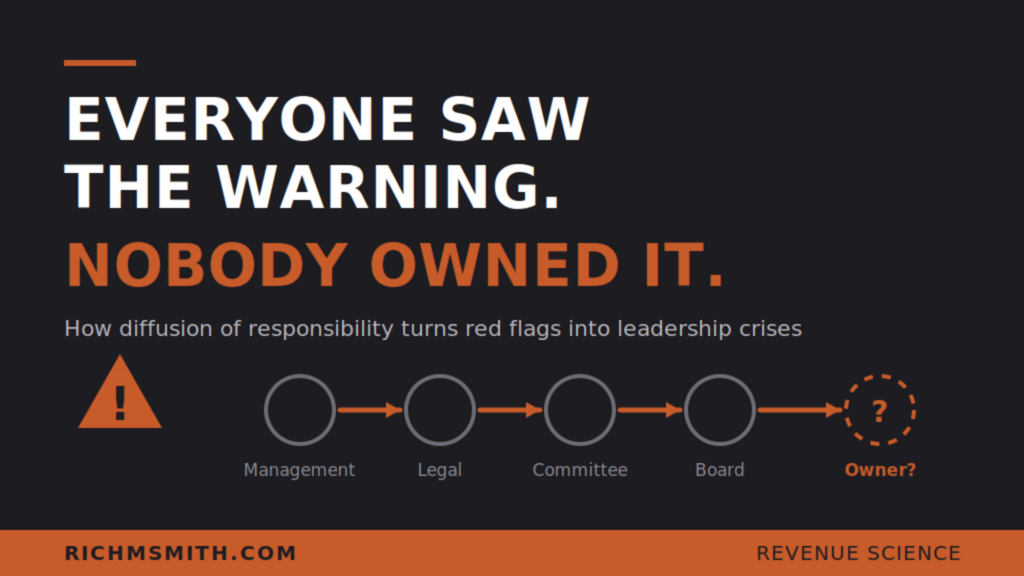
Bystander effect and diffusion of responsibility diagram analyzing the KPMG Australia whistleblower case study

Everyone Saw the Warning. Nobody Owned It.

The hotline report landed on a Tuesday. The compliance analyst logged it, marked it “significant,” and routed it to legal. Legal opened a file and copied HR. HR waited on legal. The general counsel raised it — briefly — at the quarterly risk committee, where it was noted, minuted, and

Status quo bias diagram on Cracker Barrel logo change and customer loss aversion

Cracker Barrel Changed a Logo. The CEO Is Gone.

Forty years after New Coke, another iconic American brand discovered the same thing: customers don’t evaluate change on its merits alone. They compare it with what you’re taking away. The product VP pulled up the redesign deck before the Thursday leadership sync. “The new interface tested better in every usability

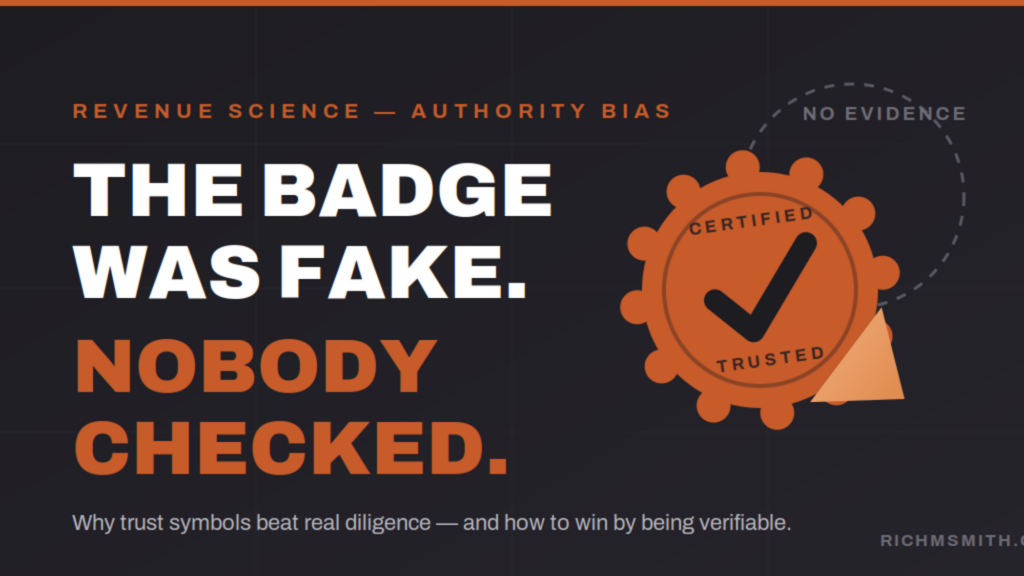
Authority bias case study diagram on Delve compliance automation and B2B vendor due diligence

The Badge Was Fake. Nobody Checked.

The deal was worth seven figures, and the security review was the last gate. The account executive dropped a link into the deal channel: the vendor’s trust center — a clean page, a wall of framework logos, a SOC 2 badge with a green check. The procurement lead had eleven

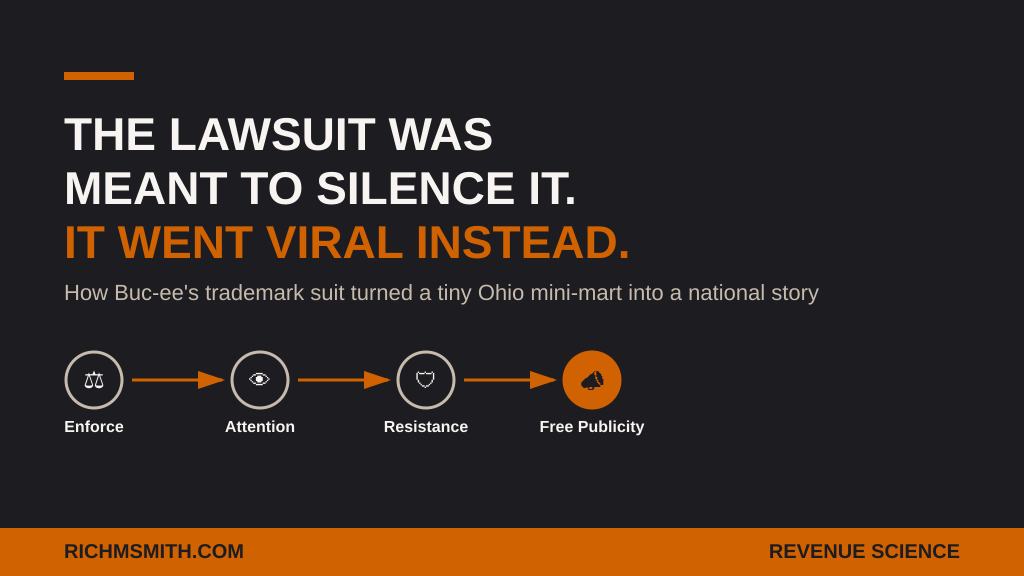
Streisand effect trademark lawsuit case study comparing brand value and public relations risk

Buc-ee’s Tried to Silence a Tiny Ohio Mini-Mart. It Made It Famous Instead.

A convenience store in Beavercreek, Ohio had a cartoon beaver on its sign for years, and almost nobody outside the neighborhood had ever heard of it. Then, on July 28, 2026, Buc-ee’s — the Texas travel-center giant built around its own grinning beaver mascot — filed a federal trademark lawsuit

WORK WITH RICH

Ready to Make Your Marketing Make Sense?

Book a free 30-minute strategy call and discover what sets your company apart.